EvilCharts
MIT-licensed React chart components that ship twice — the same API on Recharts and Apache ECharts.
- Based in
 United States
- Source & hosting
- Open source · Self-hostable
Business overview
EvilCharts is an open-source library of animated React chart components by Gurbinder (Design Engineer at Axiom.co), MIT licensed and free. It is built on two engines at once — Recharts and Apache ECharts — and styled for shadcn/ui with Tailwind, so it drops into a project already on that stack.
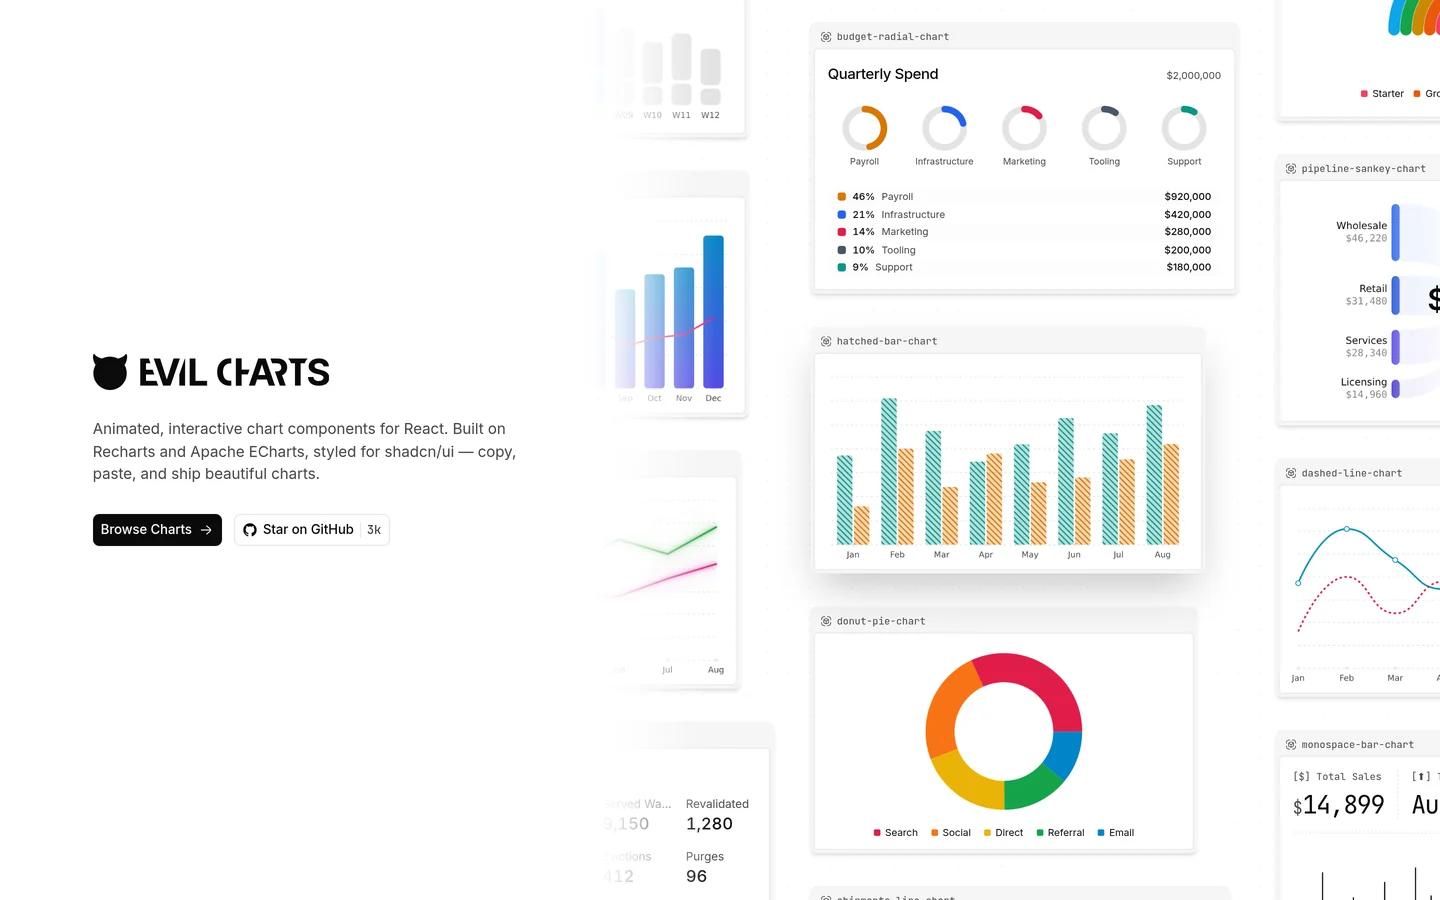
Every chart ships twice behind one compound API: <EvilAreaChart> and <EChartsAreaChart> take the same parts, config object, gradients and entrance animations. The docs put it as "switching engines is a rename, not a rewrite", and the registry manifests confirm it — the Recharts item depends on recharts + motion, the ECharts item on echarts + motion, neither pulling the other, so one engine per chart is installed, never both. The choice is per chart rather than per project: Recharts renders SVG with everything in the DOM, themable in CSS alone because series colors compile to per-chart CSS variables; ECharts renders Canvas by default, or SVG via renderer="svg", for dense or fast-updating data. One dashboard can mix both.
Per-series styling goes further than the category norm: each bar generates its own gradient and pattern definitions and takes its own fill variant — default, hatched, duotone, duotone-reverse, gradient or stripped — plus its own corner radius, an optional outer glow, click-to-select (unselected series turn semi-transparent) and a bufferBar mode that hatches the last data point while the rest stay solid, for projected data. Reveal animations come in five grow-in orders and fall back to none when the device asks for reduced motion. Tooltips, legends, an animated loading skeleton and an optional zoom Brush round out the parts.
Charts cover area, line, bar, composed, radar, pie, radial and sankey. The docs also publish named prebuilt designs — monospace, hover-trace and isometric — each its own registry item. A single chartConfig object supplies labels, optional React icons in place of the color indicator, and theme-aware color arrays that become gradients when more than one value is passed. Installation is the shadcn CLI — npx shadcn@latest add @evilcharts/recharts-area-chart — which copies source into your repository; there is no npm package, checked against the registry.
Against the rest of this directory: EvilCharts is the first charting or UI-component library listed here, and its Developer Tools neighbours are IDEs, code hosting, identity, automation, PaaS and AI agents — JetBrains, Codeberg, Forgejo, Zitadel, Ory, n8n, Coolify, Amp, Executor — none of which is a visualization layer. The design category holds one entry, Penpot, a design app, where EvilCharts is a dependency developers install.
Verified 2026-09-28: 3,004 GitHub stars, 95 forks, TypeScript, created 2025-07-16, last push 2026-08-29. What it is not: it needs shadcn/ui with Tailwind, the docs use Next.js examples, and the project publishes no company, team or location information.
Value proposition
The switch is the engine: where a Recharts chart that outgrows the DOM means a rewrite, EvilCharts ships the same component on Recharts and Apache ECharts, so moving a heavy chart over is a component rename with no bundle penalty — the two engines' dependencies are mutually exclusive.
Nobody has claimed this listing yet — it is maintained by the directory. Claim it if you work on it.
Screenshots & video
Use EvilCharts instead of
Each of these has its own page, with every option filed against it.
Reviews
From people who have actually run it. EvilCharts can respond publicly; it cannot edit or remove a review.
Your review is live. Submitting again will replace it.
That did not go through — a star rating, a comment and an email address are all required.
No reviews of EvilCharts yet. If you have used it, yours would be the first.
Review EvilCharts
One rating and a sentence is enough. Your email is never shown on the page.
Write a review
Appears in
Also from United States
AmpThe frontier coding agent — run locally or in orbs that keep working after you close your laptop.
- Cortex DocsGenerate typed SDKs, interactive docs, and MCP servers from your API specs
ElvaAPI management rebuilt for the agentic era — discover every API in your code and expose it to developers and AI agents.
ExecutorThe open source tool gateway — connect any agent to everything.
New in the registry, monthly
What was added to the registry, and which categories finally have a credible option.
You're on the list. Nothing else needed.
That address did not look right — try again.
Work on EvilCharts?
Claim the listing to post updates, add screenshots and link press coverage.
Claim this listingSponsored
Paid placements, labelled. They do not affect how anything is ranked or written.
Similar to EvilCharts
Same category, or replacing the same product.
Amp
Developer ToolsUnited States
The frontier coding agent — run locally or in orbs that keep working after you close your laptop.
Free tier, then $20/mo
Codeberg
Developer Tools Germany
Git hosting run by a Berlin non-profit association, funded by members rather than a platform strategy.
instead of GitHub
Coolify
Developer Tools Hungary
Push-to-deploy for apps and databases, on a server you are already paying for.
instead of Heroku, Vercel
Cortex Docs
Developer ToolsUnited States
Generate typed SDKs, interactive docs, and MCP servers from your API specs
Executor
Developer ToolsUnited States
The open source tool gateway — connect any agent to everything.
Forgejo
Developer ToolsGermany
The self-hostable forge behind Codeberg: pull requests, actions and packages on your own box.
instead of GitHub, GitLab
Something wrong on this page? Send a correction. Is it yours? Put a badge on your site.